Watching the Economy by Clint Burdett CMC® FIMC
October 25, 2012
Pace of a Recovery - How We Measure Matters
(Effort or How Long)
In the last days of the Presidential race, I hope you're as confused as I am about how to tell how we are doing in the recovery. This recovery is unlike any I've ever seen and the recovery is going take longer than I would like given my age and especially given the hard positions staked out by both political parties.
Taylor v Reinhart and Rogoff
Part of the confusion is respected economists are using different approaches to measure "how well the United States is recovering" from this severe, systemic financial crisis. The two fundamental measurement techniques in the news recently are:
- rate of change from the pervious year to emphasize our "effort", and
- time to regain a level of real per capita GDP to emphasize " how long under the circumstances " to get back to where we started
Effort
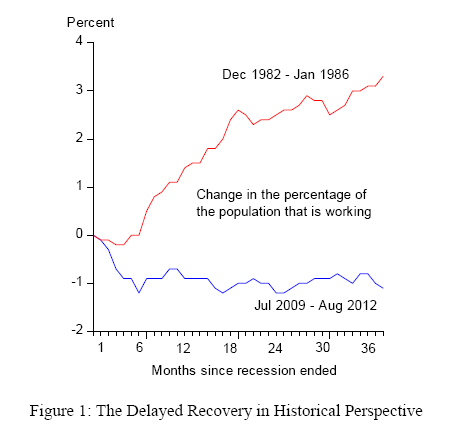
John Taylor kicked off the effort discussion in his presentation to the U.S. House Committee on the Judiciary on September 20th presenting "Government Regulatory Policies and the Delayed Economic Recovery (no longer available 2/2015)" He said were doing lousy, the rate of improvement from each past year is not good. He compared the growth in jobs from the trough of the 1982 recession (Reagan) to from the trough for 2007 recession starting in 2009 (Obama). "From the trough" means starting when the recession ends (the NBER calls the end of the recession).
Taylor focuses on the effort thereafter, comparing those working as a percent of the population between Reagan and Obama.
In context, here is the civilian employment-population ratio since 1948. Since 2001, the trend has been that fewer civilians are working as a percentage of the population and the GR accelerated that effect.

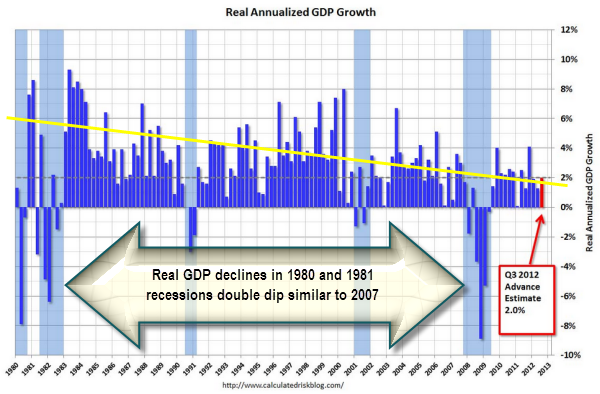
The drop in GDP during the 2007 recession and the 1980 and 1981 recessions are similar. Eyeball regression (yellow line) indicates GDP growth per quarter has declined since the early 1980s.
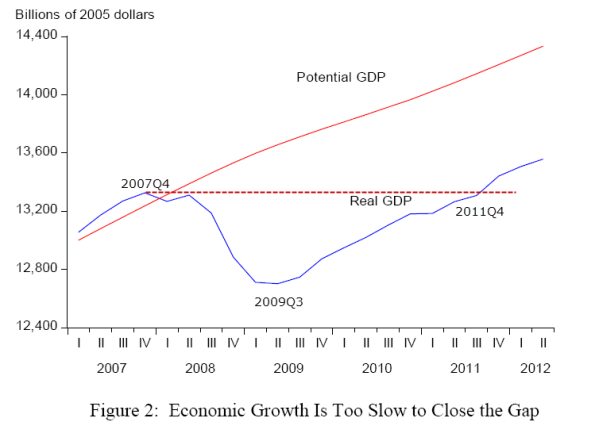
He also quoted a return to mean perspective, when will current GDP return to potential GDP, an CBO extrapolation of GDP growth before the Great Recession. The implication here is we will not return to potential GDP (the slopes are the same) for flawed effort. (But my dotted red line indicates that we have returned to the previous peak GDP dollars. I have heard the same return to mean analysis used to identify the four lost years, 2007Q4 to 2011Q4.)
Taylor concludes that the delayed recovery is due to poor government policy (Obama), primarily regulatory excess as a drag on growth and uncertainty about policy. Citing many references, notably Alan Greenspan's work in 2012, he finishes his argument listing House of Representatives bills that would have helped had they made it through the Senate (the uncertainty).
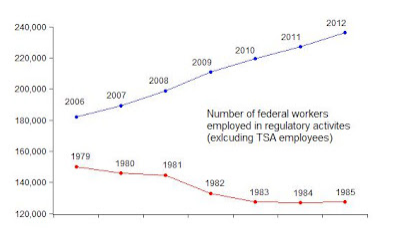
He restates his point the next day on September 21st in a chart showing the number of government employees hired to administer regulations.
[3/2013 CB: see my article March 7, 2013 Inflation to Remain Tame - Pace of Recovery Might Pick Up Later This Year using total goverment employees, which includes the military. On 1/2006 there were 21,847,000 USGOVT employess and on 1/1979 there were 15,937,000. His growth of regulatory comparisons below represent 0.009% of the total.)
He makes a powerful argument that our efforts have been thwarted by regulators and uncertainty. Change the leadership mix, resolve the uncertainty and streamline. We can be different if we just make these changes.
How Long Under the Circumstances
Three weeks later on October 14, Carmen M. Reinhart and Kenneth S. Rogoff restated their approach the measure the time to recovery using real per capita GDP from their 2009 book "This Time It's Different," and concluded that this time it is not different if you compared the Great Contraction (we call it the Great Recession) to other US severe financial crises. We are doing maybe just a bit better but we are not that different from USA past recoveries.
They disagree with Taylor on how to make the comparisons, the 1981 recession was not from a severe financial crisis with the precursors: a real estate bubble, high levels of debt, chronically large current account deficits, and signs of slowing economic activity. The 1981 recession was a double dip, a business cycle recession (I think caused by residual effects of Volker (the FED) constraining high inflation, leading to the sharp drop in GDP).
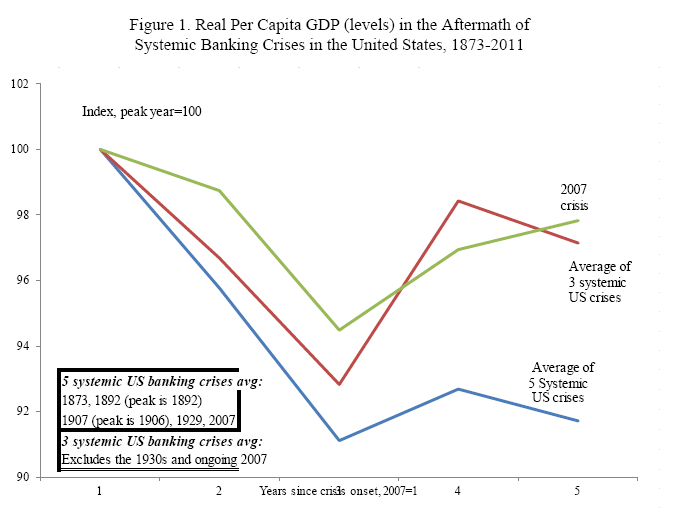
Reinhart and Rogoff measure recovery from a severe financial crisis by how long it takes to achieve the same level of real per capita GDP seen in the onset of the financial crisis. By using a ratio with one person as the denominator, they account for population differences in the different crises. Using real rather than nominal GDP accounts for inflation.
Since the decline from the peak per capital GDP usually lags the onset of the financial crisis, their charts start from the peak year rather than end of the recession and measure the years since peak Year 1. This peak year real per capita GPD is normalized to 100 so you can compared different recoveries in different time periods from the same starting point. Different from Taylor, their periods of comparison included transitions from one administration to another.
Here they compare the 2007 crisis to two groups of past severe crises in the USA with emphasis on how long for our society to recover. The green line shows five years from peak, we are doing just a bit better but not there yet. (In the return to mean chart above uses GDP dollars not per capita GDP.)
They acknowledge the importance of government policy with concerns.
This doesn’t mean that policy is irrelevant, ... On the contrary, at the depth of the recent financial crisis, there was almost certainly a risk of a second Great Depression. However, although it is clear that the challenges in recovering from financial crises are daunting, an early recognition of the likely depth and duration of the problem would certainly have been helpful, particularly in assessing various responses and their attendant risks. Policy choices also matter going forward. |
Reinhart and Rogoff make a powerful argument that we are in a protracted recovery.
Then the Taylor v Reinhart and Rogoff dust up is joined: Ezra Klein pipes in 10/15 "compared to what", Krugman a few days later on approach, and Papell and Prodan carefully dissect the Taylor and R&R's back and forth and their methods on 10/23.
Other Job Comparisons for How Long Under the Circumstances
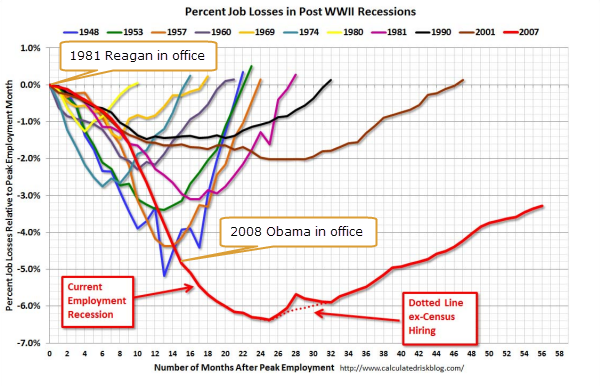
Another perspective on recovery is how long to recover from the job losses. Bill McBride (calculatedriskblog.com) presents months to job recovery from the last peak employment month as the starting point. Note that the longest recovery periods are 1957, 1981, 1990, 2001 and 2007. The pattern is that it is taking longer to recover from job loses.
The number of Federal Employees since 1939 (spikes are census temporary hires) provides a long term perspective: hiring increased from 1980, declined from 1990 and increased slightly in the 2007 recession to begin declining again after 2010. See the irony, up during Reagan, down during Clinton.

Why I Am Confused?
Well: different start points, which starting point, compared to what, ratios versus numbers, comparing presidents versus cycles, extrapolation (what if it had not happened) v real data (it happened), big picture v very fine grained data. Using numbers to advance an argument, I admit, I have been there myself.
For 2007 Great Recession, if you take politician O who had his 4 years and the next politician, R or O, who gets 4 years and add the time from onset of the crisis for politician B, the average recovery time is still about the nine years reported in Reinhart and Rogoffs' work. Their analyses will be confirmed because the political classes in a democracy seldom come together a year or two after a severe financial crises hits, think bi-year elections and the House of Representatives.
Of course Taylor is correct, without well targeted efforts (or without eliminating poorly targeted efforts) you will extend the pain, and Reinhart and Rogoff are correct, without acknowledging how long it will take to recover, our political parties can misjudge how to structure recovery efforts, increasing uncertainty.
I am still convinced that Presidents (and their teams) by themselves cannot dictate the business cycle. The passionate arguments that Party A or Party B winning is going to result in"this time we are different" by taking coup on the other party begets a predictable outcome, which makes us not different at all.
I yearn for moderation and as many say, how we measure matters.
(updated 10/27 to clarify what other followers of the dust up said)
(update 2/20/2015 after Tayor, Roggoff and Reinhart removed documents - links broken)
You may not reprint this article for sale without my expressed written permission.
You may post or reprint this article to educate as long as you credit my work
and provide a link to www.clintburdett.com
|
|