Watching the Economy by Clint Burdett CMC® FIMC
Five Charts - The Core Arguments In Congress
October 9, 2013
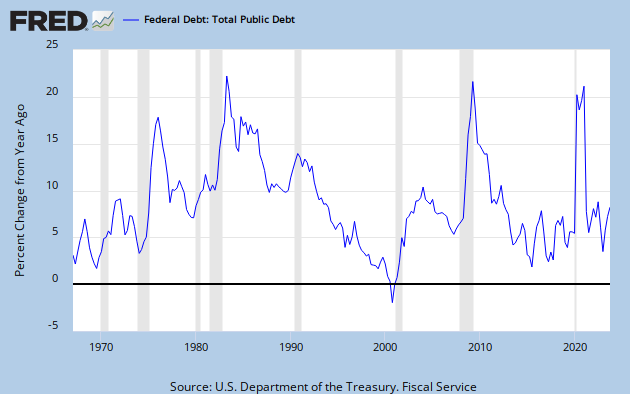
1. Our Federal Debt is higher than it has ever been (about 17 trillion). That is bad.

(Click to go to StLouisFed FRED graph editor)
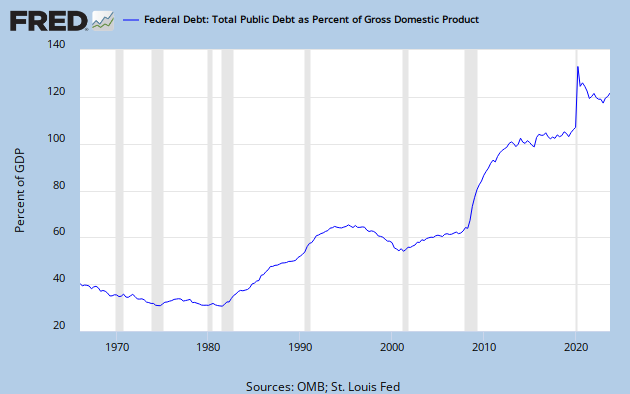
2. As a percentage of our Gross National Product, our debt exceeds a tipping point suggested by Reinhart and Rogoff. That is be really bad (but there is a heated academic debate here)!

(Click to go to StLouisFed FRED graph editor)
3. The party in power cannot control its spending coming out of a recession. Obamacare will accelerate our out of control spending and saddle us with more debt.
Take a second look at the pattern (Reagan and Bush 1 1982-1992, and Obama 2008 to date) where spending paid for by borrowing increased to re-ignite GDP growth. The red line is Federal Debt as a percentage of GDP per capita. Are we out of control?

(Click to go to StLouisFed FRED graph editor)
4. A minority in Congress, where budgets are written, must force a cut back on high spending by the majority to stop driving up debt, soon after a recession ends with substantial reductions in spending compared to the previous year.

(Click to go to StLouisFed FRED graph editor)
5. Yet, our heated political debates with no permanent winners - our system thank you James Madison - continues to work well (as long as we don't default?).
Using per capita, per citizen, comparison, we have increase our citizens' value as a percentage of GDP five fold since 1965 while Federal Debt as a percentage of GDP per citizen has been relatively constant.

(Click to go to StLouisFed FRED graph editor)
You may not reprint this article for sale without my expressed written permission.
You may post or reprint this article to educate as long as you credit my work
and provide a link to www.clintburdett.com
|
|