Key Links Clint Follows | Clint's blog on economic trends
Best Source Aggregators with links to data
Calculated Risk
The best presentation and explanation of data using charts that I know of
Ahead of the Curve
Superb l/t analysis of business cycle, link to chart, leading indicator for increased consumer spending. Updated infrequently.
Census Bureau
Summary with links to charts, reports most recent at top, often with superb charts
NBER List of Upcoming Releases
National Bureau of Economic Research, they "call" the start and stop of a recession
Pending upcoming authorative reports with links
St Louis Federal Reserve - FRED data
Online charts you can define, use their templates or search for data series
Federal Reserve h.15 daily, weekly
Daily release, weekly summary for past week released on Monday yields
Key Economic Indicators
2Yr - 10Yr Treasury Constant Mature Yield Spread
2-10 spread, negative to positive for several months indicates recession likely in just over one year
(or 10-2 spread positive to negative)
 Click to see larger image Click to see larger image
Inflation
Personal Consumption Expenditures and Core Personal Consumption Expenditures Exlcuding Food and Energy
PCEPI and PCEPILFE, the index of chained dollars -m
The Fed target is 2% for previous year to stimulate growth
 Click to see larger image Click to see larger image
Consumer Spending
Clint's exploring Joseph H. Ellis's observation of rate of change compared to last year
Real PCE bottom to end of recession and USA Total Industrial Production (Ellis's Chart 7-3)
Here there is a remarkable consistency (correlation) between Real PCE and Total Industrial Production rate of growth peak and trough year on year. I am uncertain if PCE and Production are causative. I suspect earnings, population and other factors change spending patterns.
 Click to see larger image Click to see larger image
PCE YoY % Change (PCECC96 by quarter since 1/1/1947 or PCEC96 monthly since 1/1/1999)
Personal Consumption Expenditures 2005 Chained Dollars -m
Generally, > 2.5% PCE increase from previous year sustains 3% or greater GDP growth
 Click to go to StLouisFed FRED graph editor) Click to go to StLouisFed FRED graph editor)
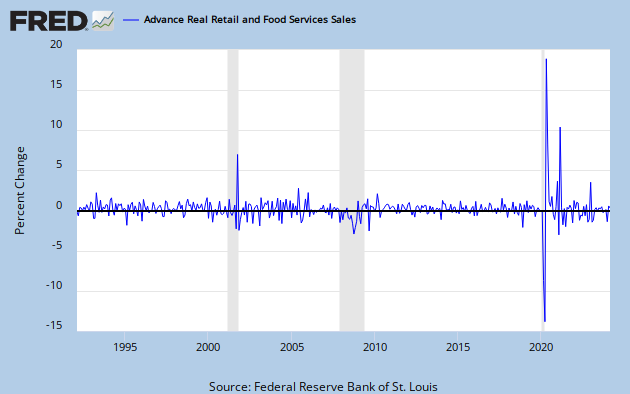
Retail Sales
Retail and Food Services Sales Change from Previous Month
% change month on month on real retail and food services sales. -abt12bd -m
Not seasonally adjusted. More positive change indicates growing economy.
 Click to go to St Louis Fed FRED graph editor Click to go to St Louis Fed FRED graph editor
Clint's Version
Compares Retail Sales ex Gasoline to PCE (consumer spending) YoY rate of growth/decline using trailing 3 months for smoothing.
A rule of thumb is a change of direction over three months is significant.
Average line for last 24 months used to determine growth rate comparisons trending up, down or flat.
 Click to see larger image Click to see larger image
Without smoothing, the movement is more dramatic, which is often called noise.
 Click to see larger image Click to see larger image
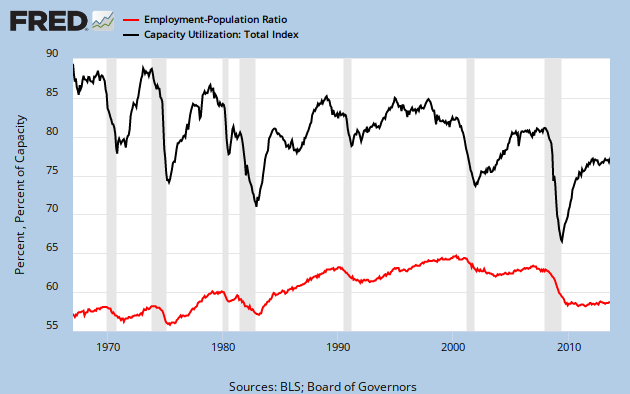
Unemployment to Total Capacity Utilization
St Louis Fred Total Capacity Utilization (TCU) and Percent of US Population Employed (EMRATIO)
Total Capacity Utilization -2m, Unemployed % of Total Population -1m
Long term trends on capacity and jobs growth or loss
 Click to go to St Louis Fed FRED graph editor Click to go to St Louis Fed FRED graph editor
Clint's Observation
In the recoveries for the 2002 recession and the 2008 Great Recession, the percentage of US population stays flat. Hiring does not exceed normal population growth.
 Click to see larger image Click to see larger image
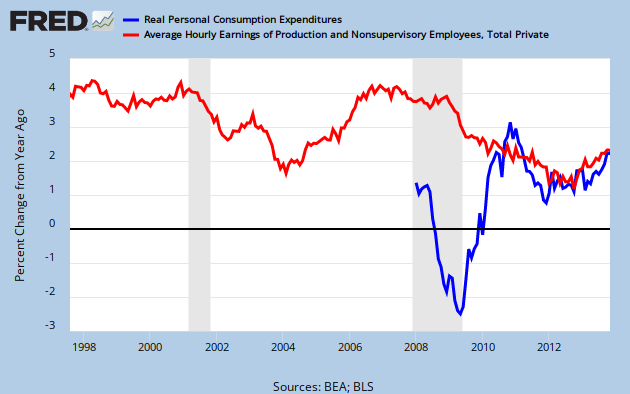
Earnings
Real PCE Rate of Change YoY to Private Industry Hourly Earnings YoY Rate of Change
Historically, downward change in an individual's real average hourly earnings a leading indicator (12 m or more) lead to PCE decline
(see AheadoftheCurve-thebook.com)
 Click to go to St Louis FED FRED graph editor Click to go to St Louis FED FRED graph editor
Clint's Observation
Total nonfarm employees times average hourly earnings equals total income. More hiring, flat wages, less income than more hiring, rising wages.
 Click to see larger image Click to see larger image
Credit and Liquidity -- reported daily
LIBOR US Over Night
London Interbank Offered Rate from British Banking Association
Overnight cost of borrowing in USD. Moves up, credit tightening.
 Click to go to St Louis Fed FRED graph editor Click to go to St Louis Fed FRED graph editor
Ted Spread 3 month
Treasury-bill to Euro Dollar spread in bps. Spread widening, liquidity being withdrawn.
 Click to go to St Louis Fed graph editor Click to go to St Louis Fed graph editor
LIBOR US 3 month term
London Interbank Offered Rate
Interest rate for bank unsecured loans. Moving up, credit tightening.
 Click to go to St Louis Fed FRED graph editor Click to go to St Louis Fed FRED graph editor
VIX (real time on Bloomberg)
Chicago Board Options Exchange Volatility Index, implied volatility in S&P 500 index options next 30 days.
Moving up, options cost more, investors expect market to be more volatile.
 Click to go to St Louis Fed FRED graph editor Click to go to St Louis Fed FRED graph editor
2YR USD Swap Spread (adjust chart period to 5 years)
The spread between the rate to exchange floating currency fixed interest payments and Treasury yields for two years notes.
A SWAP is a form of insurance, in the event the underlying securities will not make payments, the seller of the swap pays the interest and receives the underlying security. The spread is the relative "cost" of the insurance.
Housing -- for last month or quarter
Privately Owned Permits, Housing Starts, Months of Supply
Issued last Wednesday of the month for previous month
In this chart, months of supply is inverted and leads the issue of permits or start of construction
") Click to see larger image Click to see larger image
Delinquent +30 +60 +90 days
past due % of all loans
Issued in Mar, Jun, Sep, & Dec on 5th Business Day for previous quarter's data
At least two months time late.
Foreclosures % of loans
At least, two months time late
Issued in Mar, Jun, Sep, & Dec on 5th Business Day for previous quarter's data
New Home Sales
Annual pace of sales from Census & HUD
(SAAR seasonal adjusted annual rate 000)
Issued 4th Wednesday for previous month's data
For new construction reported upon a deposit at any stage of construction.
Months Supply Supply New Homes
See 1st page of Census press release in PDF
Pending Home Sales
MoM (month on month) % change pending home sale index
Issued 4th Wednesday for previous month's data
Contract signed to buy previously owned home, waiting on escrow about 2 months out. Similar to New Home Sales after deposit.
Existing Home Sales
Annual pace of sales (SAAR 000,000)
Issued 4th Wednesday for previous month's data
Report after closing escrow.
Months Supply Existing Homes
Months of supply of existing homes.
Issued 3rd Thursday for previous month's data
Normal is about 7 months or less.
National Association of Home Builders (NAHB) Housing Contribution to GDP
Breakout of GDP from private investment (new homes) and housing services from BEA GDP data
One quarter in the past
Since 1970 -2009 averaging 18.1%, last 6 quarters through 13Q1 15.1%
|