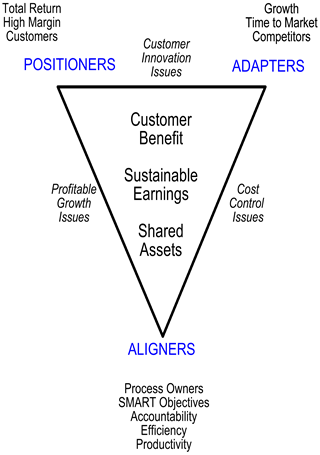
Future Demand
Macro Trends
Customer and
Supplier Channels
Complementors
Processes
Value Chain
Employees
Customers
Financial
|
 Who
does the research Meeting Planning Who
does the research Meeting Planning 
Strategy Planning Resources |
 Strategy formulation involves study. The information via the internet has EXPLODED the last few years. For branding advantages, more and more data resource companies are offering their research for free. Strategy formulation involves study. The information via the internet has EXPLODED the last few years. For branding advantages, more and more data resource companies are offering their research for free.
This chapter suggests web sources I have used to identify demand, economic and technology trends, competitive forces in distribution and supply channels, strategies of public and private companies, and Google search terms to help you focus on your industry.
As we mature into more responsible leadership positions, understanding the "big picture" is important, and the quality and effectiveness of strategic planning will improve as one better recognizes trends.
Sam Walton's made a lifetime commitment
to investigate what everyone in the discount retail industry was
doing and how it impacted his customers, a critical success factor in WalMart's early growth.
In nothing else is studied, my advice is to spend time with your customers and visit
your competitors often.

I picked up an
idea from Robert Beachler with Altera. He recommends visiting your customers
by making the rounds from "least" important first
to "most" important last: to see how goes it, to read trends,
to ask about the competition ...
|
| top |
Scenarios

The Scenario
Approach involves identifying demand in the future, so
you can adapt your business faster. There are three primary sources of data:
demographics, technology development and geographic segmentation of customers
(that's a fancy way of saying what are they doing in China, India, Europe
or Japan, on the other coast, etc.).
There are associations that specialize in identifying future trends, for ample The
Futurist.
Demographics
The best sources of demographic data are the national census
websites, for the USA www.Census.gov.
The Google keywords are: "census data worldwide"
Local governments and universities often have very good census data
matched to maps using geographic information system software (GIS). Click to
see an example of San Diego County California data. The Google keywords
are: "census gis <add your location>"
Technology development
Complex technology requires that manufacturers and users establish
interoperability standards. For example, for the internet, you can follow
its evolution and anticipate future functionality at the W3C
- The World Wide Web Consortium. Most industry groups have standards
committees, which today summarize their discussions on the Web. If you
are involved in developing scenarios, you should attend or join your industry
standards
group. The
Google keywords are: "standards" and descriptive terms for your
product or service. Click on "manufacturing standards" as an example.
International segmentation
After living in Japan for two years and Belgium for three years, I observed
that great ideas for products and services for customers can be developed
miles from home. It would be a dream job to be paid to travel around
the world and observe what's new, simpler, or just plain better. To identify
these opportunities from afar is hard. If you are part of a large, multinational
corporation, you need to cultivate relationships with folks from other
regions.
There are consulting firms that specialize in market research. They
catalog and quantify extra-regional trends. In the food industry,
an
example
is Technomic Inc.,
or for the information technology, Gartner.
If you don't know who is watching worldwide developments, call your industry
association and ask them.
|
| top |
Under Scenarios, I suggested sources for demographic
and technology data, where you will spot patterns. Once
the trend becomes common knowledge, it will create demand.
The other macro-areas
are environmental, societal, economic, government. Don't restrict folks
who want to broaden the areas
from six that follow. They are indicating their areas of concern.
The best database I've found is ABI/Inform,
published by UMI (www.umi.com), which is available by subscription though
services like LexisNexis or Proquest®, UMI's on-line service. Most larger corporations Marketing Departments have a LexisNexis subscription. You can often
access ABI/Inform for free from the public terminals at university research libraries.
The database provides abstracts from most periodicals and major newspapers
and has a very easy to use
search
system. In ABI/Inform search for "trend" and "your industry".
Finally, most college students get free online access to ABI/Inform so keep your kids in college forever to use their account.
Environmental
The availability of raw materials, the effects of long term weather
trends, development of key infrastructure, etc. The academic community
and government
are the best sources of data, usually free.
I used air plane landings as an example earlier. I'd structure my search
using two approaches: first, I searched the Federal
Aviation Administration's website, then the Library
of Congress website, where I can access many databases
from the web. Finally, once I had a good idea of the keywords used to
describe the environmental factor, I searched Google, for example, for
the international travelers by air, using this link.
Societal
Cultural norms, attitudes, social classes, lifestyles, and history affect
how people and businesses make decisions -- their buying behavior. ABI/Inform
is the best source, where you would search by the group you are investigating
or for "trends" reported in industry periodicals like Advertising
Age, Brandweek,
Target Marketing, SuperMarket Business, American Demographics. For
industrial perspectives, there are industry periodical like Oil and
Gas, AutoFacts.com. Search Google using keywords: "fill
in your industry" industry periodicals
Economic
Income distributions, disposable income, an industry's capacity, and
job growth and loss are the starting points. How economically healthy
are my buyer and my industry. The US
Bureau of Labor Standards and US
Census Bureaus , particularly the Census's summary of economic indicators and the National Bureau of Economic Research's summary of Economic Indicators and News Releases, are the places to start. For an international perspective,
go the Dept.
of Commerce Data and Reports page. For the business cycle, Joseph H. Ellis's "Ahead of the Curve: A Commonsense Guide to Forecasting Business and Market Cycles" is superb.
My take on the economy is updated frequently.
I follow the CalculatedRisk for insight on the US economy, which summarizes with superb graphical analyses the data. David Rosenberg also provides a daily update. He was Merrill Lynch's US Domestic Economist and now is the Chief Economist for Gluskin Sheff'. Both CalculatedRisk and Mr. Rosenberg point to other experts in their public articles..
Government
Governments change overtime, as the electorate makes adjustments. Any
good newspaper with both a national and international section will keep
you up to date. I subscribe to and use the Wall
Street Journal's electronic version. In the US, the Library of Congress's
Thomas database will
give you status on proposed legislation and point you to State resources.
|
| top |
The Macro Trends should focus the study of your industry. Next, what specifically is happening in the key supply and distribution (or buyer) channels.
Supplier and Buyer Channels
If you are in a regulated industry, call the government statistic keepers
and ask them what patterns they are seeing. They will
not give you specifics on a competitor, but will give you the big picture.
For example: for the food industry, the USDA
Economic Research Service, or for the Insurance Industry, your states
Insurance Commissioner. You can also ask the "statistics keeper" for
you industry association. Try variations of these Google keywords: <fill
in your industry> regulator state federal
Rivalry - your direct competitors
Ask your customers what the competition is doing?
New Entrants, who begin to sell at a substantially better price point
Ask your customers who the new, low cost competitor is?
Substitutes - products that replace your product with a new technology
Your R&D folks or business development should keep an eye on new patents
at the US Patents Office and follow the links from there.
|
| top |
Complementors
Complementors do not compete directly with you, but do sell to your customers or buy from your suppliers.
They will significantly
influence your business's success - think of Intel and Microsoft. You want these relationships will create demand for your product or service, and
the academic community best studies these relationships.
Identifying these
relationships can be a subtle task.
Ask your customers and ask your customers'
customers what product or service you do not sell influenced their decision to buy your offering.
To look for similar groupings of complementors, try
variations of these Google keywords: <fill
in your industry>
"chamber of commerce" or association
|
| top |
 There
has been exceptional energy dedicated to understanding the value of an
organization processes and the value created or lost by those processes. There
has been exceptional energy dedicated to understanding the value of an
organization processes and the value created or lost by those processes.
Fully mapping all the activities of an
organization,
determining each activities contribution, determining its cost in salary
or time, finding the non-value added activities to element. It is a
huge effort. Business with activity based management detail in their
information
system can extract excellent information, often real time. Supply chain
management or customer relationship management systems will get better
and better at providing detail for analysis.
That being said, in 2002, some of the best IS hardware manufacturers
had no idea how much idle inventory was in their distribution chain.
People dread implementing SAP or Oracle business suites. It is a huge
commitment of time and often a major restructuring of how you do business.
To me, this type of work is an output of a fundamental strategic decision
about business design. The inputs are: how do you compare to the best
companies in your industry. Who gets the work done in the least amount
of time and at the lowest cost.
Your research should focus on understanding your performance vs your
industry. Start looking for benchmark data through your industry association,
then through benchmarking organizations. Define your measure and review
industry data through the American
Productivity and Quality Center, particularly its List
of Measures,
or the European
Foundation of Quality Management, both membership organizations.
Try Google keywords: "fill in your industry or product name"
quality performance measurement benchmark
|
| top |
 The best source is to ask your customers. The best source is to ask your customers.
Usually, phone interviews
with 20 - 25 customers will provide the information you need to understand
how you are perceived. For larger, retail firms customer surveys or
focus group are used.
Critical data
Critical data are: how are we doing? our competitors?
how many customers buy a second time? how many customers have we
lost?
Other sources are from market research firms, industry associations,
customer associations or advisory groups, and the press.
More detail
What routes lead to new customer segments? You need to
be able to describe and track their:
- Geographic - regional groupings
- Demographics - age, income, education, family life-cycle, status,
occupation, religion, or ethnicity
- Psychographics - patterns of behavior and beliefs, which can be
linked to buyer groups
- Benefits desired - price sensitivity, advertising
sensitivity, or product quality
- Volume - patterns and quantity of
consumption
- Marketing-factor - advertising effectiveness
- Brand preferences - compare existing
brands to each other and to an ideal brand
Earlier, I described how to use an Importance/Performance
Matrix to track customers' buying decision. |
| top |
 Like your customers, the best source to find out about your employees
is to ask them about their morale and how much they feel ownership for
their role in your business. You may wish to have a third party conduct
interviews or a survey, as long as the results will be discussed with
your folks and you are prepared to take action on their recommendations. Like your customers, the best source to find out about your employees
is to ask them about their morale and how much they feel ownership for
their role in your business. You may wish to have a third party conduct
interviews or a survey, as long as the results will be discussed with
your folks and you are prepared to take action on their recommendations.
A good source for big picture data about employee mobility and hiring
patterns is www.bls.gov.
|
| top |
The most studied business data are financials.
Pubic Companies
For publicly owned companies, there are many quality sources. Start
with the Security and Exchange Commissions Edgar database.
Here are reams of information, particularly the Form 10-K, the Annual
Reports, and the Form 10-Qs, the Quarterly Reports. Then go to a good
web service like Yahoo
Financials.
 Next are the subscription services. The best academic database is the
Profit
Impact of Market Strategy (PIMS) database developed by The Strategy
Planning Institute. Next are the subscription services. The best academic database is the
Profit
Impact of Market Strategy (PIMS) database developed by The Strategy
Planning Institute.
For industry analyses, Value
Line have the information for sale. Most brokers provide superb research if you have an account. I use Schwab.com.
A free source, free if you have a brokerage account, are analyst
reports. Business Week, the Wall Street Journal, Baron's, Forbes, and
the Economists have good analytical work, with archives available to
subscribers.
Private Companies
For privately owned firms, competitive data is more closely held. A
good valuation firm can estimate benchmarks for these companies. Some
information
is
available through the Institute
of Business Appraisers or the American
Society of Appraisers. You can get some
basic detail from Hoovers or
through Dunn and Bradstreet or the rating company your firm works through
to qualify companies for account receivable.
|
|
|
|